The Role of Data-Driven Insights in Shaping Sales Strategies

What’s the difference between a good salesperson and a great salesperson?
How they leverage data.
(sorry if you were expecting a joke).
Sure, you might have all the wit, charm, and charisma in the world – but so do loads of other sales reps. How you’ll stand out is how well you understand and respond to your customers. The best way to get inside their heads (in a non-creepy way)? Data-driven insights.
Think about this for a second: top performers spend about 10% less time selling than average performers. Instead, they spend time digging into data and using what they find to fine-tune their processes, before reaching out. They don’t need that extra time selling, because their homework has already sped up the process.
But what actually are data-driven insights? We think this quote from Carly Fiorina sums it up nicely:
“The goal is to turn data into information, and information into insight.”
In this blog post, we’re going to teach you how to do exactly that. We’ll show you where data fits into your sales strategy, what kind of data you need to be successful and how to find the right tools to turn all this data into insights you can apply to your own sales activities.
Sounds good? Let’s get started.
Key highlights:

The importance of data in sales
60% of B2B sales organisations will move to a data-driven approach by 2025. Data helps you at every stage of the sales process – from lead generation, to nurture, to closing a deal.
The more knowledge you have about your prospects, the more informed your actions and messaging are and the more in control you are of the process. Let’s find out what the key benefits of using data in sales are:
Increased efficiency: when you’re generating leads at scale, it can be hard to identify who to put effort into, and when. Data also helps you self-report on how you’re doing and where you could improve.
Better targeting: data helps you avoid customers who are a bad fit (if they look nothing like your ICP, in other words) and find customers who are ready to buy. There’s no point channelling loads of energy into someone that’s just signed a two-year deal with a competitor, for example. On the other hand, if they’re visiting your competitor comparison pages you probably should be pouring loads of energy into them.
Improved customer relationships: if you know exactly who your customers are and what their pain points are, you’ll be able to help them. For example, if you notice them engaging with a piece of content on a particular problem, why not point them toward your company’s whitepaper on the same topic? Building a reciprocal relationship is one of the six elements of persuasion; give your prospects help, and they’re more likely to give you something back.

Types of data essential for sales strategies
Broadly speaking, we can divide sales data into three areas: customer data, market data and sales performance data:
Examples of customer data:
Demographic information: age, location and job title
Psychographic information: interests and values
Behavioural data: purchase history and website interactions
Examples of market data:
Industry trends: has a new piece of legislation just been introduced? Is the industry facing a challenge, like a staffing crisis?
Competitive analysis: are your lead’s competitors all launching new tools, or buying similar products?
Economic indicators: what’s the funding market like at the moment? Which industries are doing well, and which are struggling?
Sales performance data:
Sales metrics: you’ll already be familiar with these. We’re talking conversion rates, and average deal size, for example.
Sales rep performance: who on the team stands out? What are they doing differently to everyone else?
Pipeline data: how full – or empty – is your pipeline? What’s its value? When are deals going to progress?
These three categories of data all – directly or indirectly – influence what a sales strategy should be. You’re not going to build or execute an effective one if you’re only focussing on sales rep performance, and ignoring what your customers are saying or what’s happening in the market, for example.

Turning data into insights
So far, we’ve taken a look at what different types of data are going to influence a sales strategy, and why each one is important. But how do we actually 1) find these data points and 2) turn it into insights?
Let’s go through things step-by-step.
Step 1: Collect your data
We’re going to go out on a limb and say that your organisation probably relies on a lot of tools for this, such as:
- CRMs: like Hubspot and Salesforce, for example
- LinkedIn: where the majority of B2B lead generation takes place
- Intent data providers: these could be traditional third-party data providers, specialized ABM platform providers, campaign execution firms or walled gardens.
Wherever you collect your data from – probably a combination of the above – it’s best practice to:
- Have multiple data collection methods: if you’re sourcing contact data using LinkedIn, for example, it’s best practice to cross-reference their contact details with different tools to make sure it’s accurate
- Make sure it’s clean: you don’t want to end up with duplicate, incomplete or corrupt data in your CRM. At best, it’s a hassle for whoever has to clean it up later down the line. At worst, you could make a mistake like emailing a prospect twice.
- Input it correctly: put in the wrong data – whether it’s the wrong number completely or the information in the wrong place – and you’re setting yourself up for a fail. It pays to be careful!
2. Analyze your data
Techniques for data analysis include:
- Segmentation: dividing your contact data into specific groups (such as industry or company size) to meet the unique needs of each segment.
- Trend analysis: how long your sales cycles usually are, or using predictive analysis to assess historical data and use what you find to predict future trends.
- Cross-referencing: you want to combine different data sets to get truly comprehensive insights rather than hedging your bets on just one. To use a really basic example, if you recently closed three deals in the same industry, you shouldn’t take that as an excuse to go wild and contact every single business in that industry that ever existed. But if you also know that the three businesses you closed are all the same size, that’s more informative when it comes to who to go after next.
3. Visualize your data
Tools for visualizing data include:
- Dashboards
- Charts
- Graphs
Visualizing data is a far, far more efficient way of identifying patterns and trends. Rather than combing through a looooong list, you can see what’s happening at a glance. Plus, visual data is a lot easier to explain to someone else – important if internal presentations are a part of your role.
Applying data-driven insights to sales processes
Ok, you’ve done the hard bit: gathering, analysing and visualising your data. Now it’s time to apply it to your processes, and become your team’s star player. You can apply your data-driven insights to four different parts of the sales process:
Lead generation
Use data to identify and prioritize high-quality leads. This could be using historical sales data to decide what profiles to hunt down on LinkedIn, for example.
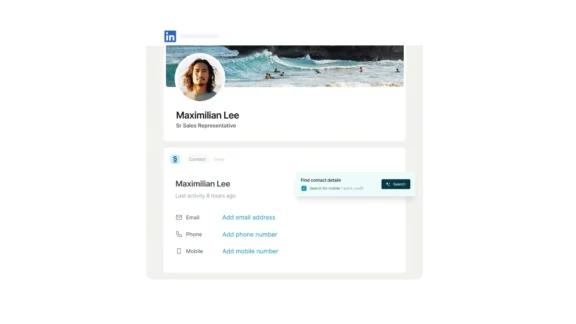
Tools to help with lead generation include LinkedIn Sales Navigator to find ICP profiles by filter, and integrated contact data finders like Surfe 😉 to search for their email addresses and phone numbers.
Customer segmentation
Segment your customers based on data insights for targeted marketing. You might segment your lead list by role, and then launch a multi-channel marketing campaign that speaks specifically to the pain points of this role.
Or, you could use this data to create personalised sales pitches – like recording a Loom to explain your product to a senior role you know is likely to have a hand in the decision-making process.
Sales forecasting
In a nutshell, this is predicting future sales based on historical data and trends. This could be as simple as knowing that you’re unlikely to make any sales in December, so making sure reps focus on generating and warming up prospects during this time.
By knowing what’s happened in the past, and what’s likely to happen in the future, you can adjust your sales strategies to make sure that you meet your targets – and have no nasty surprises.
Performance optimization
Digging into your team’s performance data will help you monitor and improve their performance. It’s useful here to look at both individual performance and team performance as a whole.
For example, if all of your reps are struggling with a bottleneck then the problem’s likely to be external. But if just one rep is, you know exactly where to help them make improvements.
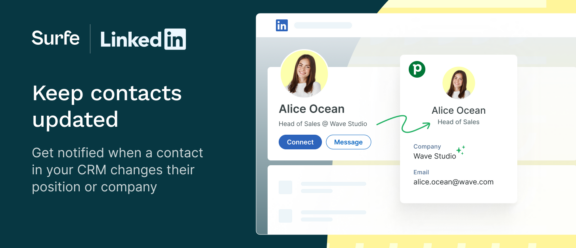
Top tip: Use a third-party Chrome extension like Surfe to automatically migrate data from LinkedIn contact’s profiles to your CRM in one click!

Finding the right tools for data-driven sales strategies
There are plenty of tools that can help you use data to do your best work:
CRMs: tools like HubSpot and Salesforce store contact data, track individual activity and your pipeline, and provide data visualisation so you can see what’s working and what’s not
Data analytics: these tools automatically gather sales data, and then present the metrics you need to inform your sales strategies in an easy-to-understand format. Examples include Zendesk and Pipedrive.
Data enrichment: data enrichment is adding new data to what you have already. It often involves using third-party data sources – like Surfe 😉 to make sure you have every piece of data on your prospect that’s out there
Most businesses will go for a multi-tool approach when choosing sales data tools. For this reason, you’ll want to prioritise tools that integrate with each other, so they can work together rather than in siloes.
If you’ll let us show off for a minute – that’s exactly why we made sure Surfe aggregates the best of data enrichment tools and CRMs to make the data-gathering process super-seamless.
Segregation aside, what you choose will depend on your business’s needs – look for tools that directly speak to the data that’s most valuable to you. Then, follow up by checking accuracy, security, scalability and support.

Best practices for implementing data-driven sales strategies
Hopefully we’ve shown you that data can be your best friend when it comes to sales – but it can also be your worst enemy if not handled correctly. Here’s what to keep an eye on:
Accuracy and completeness: inaccurate data leads to inaccurate decisions. These could be embarrassing – like getting your sales outreach wrong – or downright catastrophic – like messing up forecasting.
Regularly updating and maintaining data: this speaks to the above. Things change! People move on, markets adjust, trends happen. Make sure your data is up-to-date at all times to avoid any mishaps.
Train your sales teams: make sure your teams understand why it’s so important to be careful with data – but also on the benefits of using it. A high-performing team is going to have every member making data-informed decisions daily.
Continuous monitoring: make sure you’re up-to-date with what’s going on and what might have changed. It’s easy for sales teams to rely on instinct if things have been a certain way for a while – but getting comfortable is the enemy of progress.
Let’s wrap it up!
Data insight is a beautiful thing. It can help you predict the future, find out what your customers are thinking and make sure you hit target – all without relying on just your luck, charm and talent.
Combine the two, however, and you’ll be onto a winner. See you on the podium.
Become a smarter salesperson today
Start using data to inform your sales strategy, and you’ll be onto a winner.
The best part? It doesn’t have to be complicated. Use Surfe to automatically populate your CRM with accurate, up-to-date data in seconds.
FAQs about the role of data-driven insights in shaping sales strategies
What are some examples of data-driven insights?
Data-driven insights can be divided into three broad areas:
- Customer data: demographics, psychographic information and behavioural data
- Market data: industry trends, competitive analysis and economic indicators
- Sales performance data: sales metrics, sales rep performance, and pipeline data
How do you get insights from sales data?
Follow these steps to get insights from sales data:
- Collect your data: make sure you have multiple data collection methods, make sure it’s clean and input it correctly.
- Analyse your data: use segmentation, trend analysis and cross-referencing to get the insights you need.
- Visualise your data: use dashboards, charts and graphs to easily spot trends and anomalies, and explain them to others.
How can B2B companies use data to improve customer data?
B2B companies can use data enrichment tools to improve customer data they already have. For example, a tool like Surfe aggregates several email and phone number search tools to find contact data in seconds. It then automates updating the business’s CMS with this data, populating any empty fields with what it’s found.
What is a data-driven sales strategy?
A data-driven sales strategy is adopted by forward-thinking sales organisations that want to use data to inform their sales activities. A data-driven sales strategy involves using customer, market and sales data to inform how and when to approach prospects, and to monitor business and team performance.


